
© 2026 Monument Traders Alliance, LLC

Normally, I’d be weaving a story around horse racing, football, or something “investable” I noticed walking down the street.
Not today.
Today calls for numbers and market history.
I know… Seasonality can feel like a loose research angle for stocks.
Wrong. Ignore it at your own risk.
When a few months of seasonality can make the difference in the market’s next 10%-20% directional move, you dig deep and learn.
You hear me say it all the time, but listen up.
October’s reputation for sharp moves can make long-term investors uncomfortable, but those same moves are exactly what short-term traders want. Bigger one-day swings create more setups, faster moves, and more chances to take advantage of traders who react emotionally instead of technically.
October is a target-rich environment.
Forget the month of crashes. Forget the October Effect.
For more than a decade, I’ve called October “The Cardiac Kid.”
October has a habit of scaring the hell out of investors, looking like a zombie that’s about to fall apart, then getting off the mat just when everyone thinks the fight is over.
And this year’s setup is especially interesting.
On paper, September is one of the worst months of the year. This one lived up to its reputation beneath the surface, even if the headline indices told different stories.
The Nasdaq-100 gained a respectable 3.3% as investors simply couldn’t stay away from AI, even with semiconductor and memory stocks looking downright dire at times.
The S&P 500 slipped roughly half a percent but remained remarkably resilient. The Russell 2000 dropped more than 5%.
That’s where September got ugly.
The 10-year Treasury yield surged 54 basis points to 5.29%, its largest monthly increase in four years, and higher borrowing costs hammered small caps.
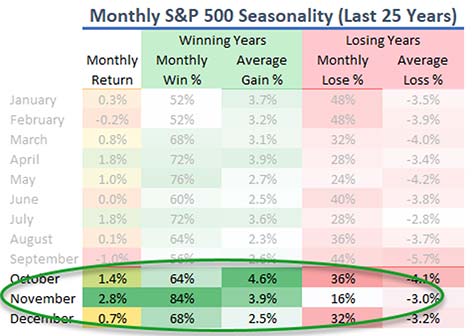 |
Over the last 25 years, the S&P 500 has averaged roughly 1.4% in October, finishing higher 64% of the time.
But here’s the number that catches my attention.
When October wins, those winning months have averaged approximately 4.6%.
That matters even more in a midterm election year.
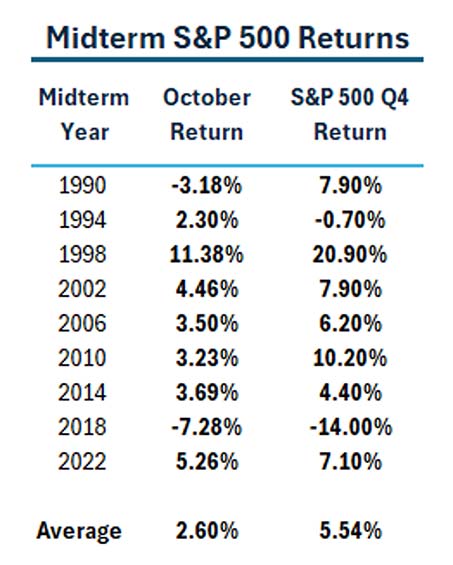 |
Since 1950, October has been the strongest month of the year during midterm years, averaging approximately 3%, with the S&P 500 finishing higher nearly 74% of the time.
My own look at midterm Octobers since 1990 tells a similar story. Seven of the nine finished higher, averaging approximately 2.6%.
Why start at 1990? Because today’s market doesn’t trade anything like the market of the 1970s. Don’t fall prey to expecting 1970s responses from a modern market.
Right now, investors crave certainty… something that lets them stop worrying about what might happen and put money to work based on what is happening.
Remember August?
Investors entered the month worried about weak seasonality, low volume, and another summer selloff.
Instead, the Magnificent Seven delivered another round of generally strong earnings, giving investors enough confidence in AI to look past higher rates and inflation.
The Nasdaq-100 gained 4.2%.
Now we’re searching for certainty again.
October has two potential sources.
Third-quarter earnings season kicks into high gear next week with the big banks.
JPMorgan (JPM) reports October 13, followed by Bank of America (BAC) on October 14.
But investors aren’t going to obsess over loan growth or net interest margins.
They’re going to listen to what Jamie Dimon and Brian Moynihan say about interest rates, credit, and the consumer.
That’s the driver.
The 10-year recently pushed above 5.3%, its highest level in roughly 24 years, and that pressure is already showing up in housing-sensitive stocks and other credit-dependent areas.
Earnings can provide certainty about corporate America.
But the second catalyst is much larger.
Less than a month from now, Americans vote in the midterm elections.
Ignore the politics for a moment.
From the market’s perspective, Election Day removes uncertainty. For this trade, it doesn’t necessarily matter which party wins the House or Senate, although investors have historically viewed divided government favorably.
The fourth quarter averages approximately 4.2%, but that jumps to roughly 6.4% during midterm years (more than a 50% increase).
Think about the sequence.
A historically strong midterm October, a historically strong November, then December and the traditional year-end rally.
That’s a strong hand.
But don’t confuse a strong hand with a guaranteed winner.
The last Trump midterm provides a warning.
The S&P 500 lost more than 7% in October 2018 as rising rates, Fed tightening, and trade concerns overwhelmed the seasonal tailwind.
Then came Election Day.
The S&P jumped more than 2% the following day and finished November higher.
Certainty provided a catalyst.
But it didn’t fix everything.
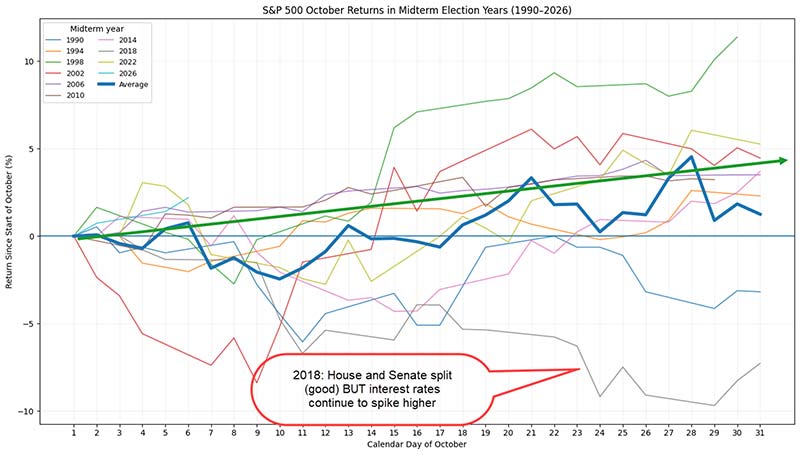
Rates, the Fed, trade, and economic-growth concerns remained. December turned brutal, and the market sold off hard into Christmas.
That’s the lesson.
We’ll be monitoring everything before and after Election Day in case a portfolio adjustment is needed.
First, take advantage of the day-to-day volatility. It won’t get much better than this!
Next, the midterms can provide a powerful catalyst, but I hate to tell you this: The bond traders are still in charge.
If yields stabilize, earnings remain strong and Election Day removes another layer of uncertainty, history says the fourth-quarter setup gets very interesting.
If the 10-year keeps screaming higher, history isn’t going to save the market.
That’s the Cardiac Kid.
It can knock investors down, convince them the seasonal playbook is broken, then get off the canvas swinging… sometimes almost overnight.
This may feel like the perfect environment to move to the sidelines and wait until everything becomes obvious.
But be careful.
By the time it’s obvious, the move may already be underway.
This market is set to react fast and aggressively when certainty finally arrives.
